This is a new article for the blog serie called "RARE Day One". Today we will explore one of freeRouter killer feature that will make your life easier during your day to day operation: freeRouter assisted diagnosis command.
Requirement- Basic Linux/Unix knowledge
- Service provider networking knowledge
| |
Overview
As previously mentioned in the precendent article, when you log into a network equipment such as a router, you tend to have some automatic reflex. You usually:
- Check router configuration: show run or sh conf
- Check ipv4 / ipv6 / or LFIB forwarding table
- So you basically issue diagnosis, troubleshooting command
- An then you want to configure the router
Article objective
In this article, we will focus on the 3rd bullet point and will present you freeRouter available diagnosis command. They are grouped into 5 categories:
...
Basically these commands are accessed through freeRouter user mode. If you need to use them from config mode, please use the "do" keyword.
[ #002 ] - "show/view/watch/display/differ"
| Expand |
|---|
|
You would mostly be familiar with the "show" command. It is very good and can basically be used to get output from control plane object. Most of the time this can be used against static object like config. Let's assume that I would like to get BGP config from my home router: | Code Block |
|---|
| language | bash |
|---|
| theme | Midnight |
|---|
| title | show BGP configuration from running config |
|---|
| show running-config bgp4
router bgp4 42
vrf dn42
local-as 4242421975
router-id 172.22.105.65
address-family unicast multicast other flowspec vpnuni vpnmlt vpnflw ovpnuni ovpnmlt ovpnflw vpls mspw evpn mdt srte mvpn omvpn
neighbor 172.23.215.177 remote-as 4242421955
neighbor 172.23.215.177 description NOP.DN42
neighbor 172.23.215.177 local-as 4242421975
neighbor 172.23.215.177 address-family unicast multicast other flowspec vpnuni vpnmlt vpnflw ovpnuni ovpnmlt ovpnflw vpls mspw evpn mdt srte mvpn omvpn
neighbor 172.23.215.177 distance 20
justadvert loopback42
exit |
But I can also check the status of BGP peering into VRF dn42 | Code Block |
|---|
| language | bash |
|---|
| theme | Midnight |
|---|
| title | Check BGP IPv4 peers status in VRF dn42 |
|---|
| show ipv4 bgp 42 summary
as learn done ready neighbor uptime
4242421955 517 518 true 172.23.215.177 00:38:18 |
Check the same BGP peering but now for IPv6 | Code Block |
|---|
| language | bash |
|---|
| theme | Midnight |
|---|
| title | Check BGP IPv6 peers status in VRF dn42 |
|---|
| r1#show ipv6 bgp 42 summary
as learn done ready neighbor uptime
4242421955 351 352 true fd40:cc1e:c0de::151 00:40:40
show ipv4 bgp 42 summary
as          learn  done  ready  neighbor        uptime
4242421955 517 518 true 172.23.215.177 00:38:18 |
Let's see some BGP prefix received in VRF dn42 bgp table: 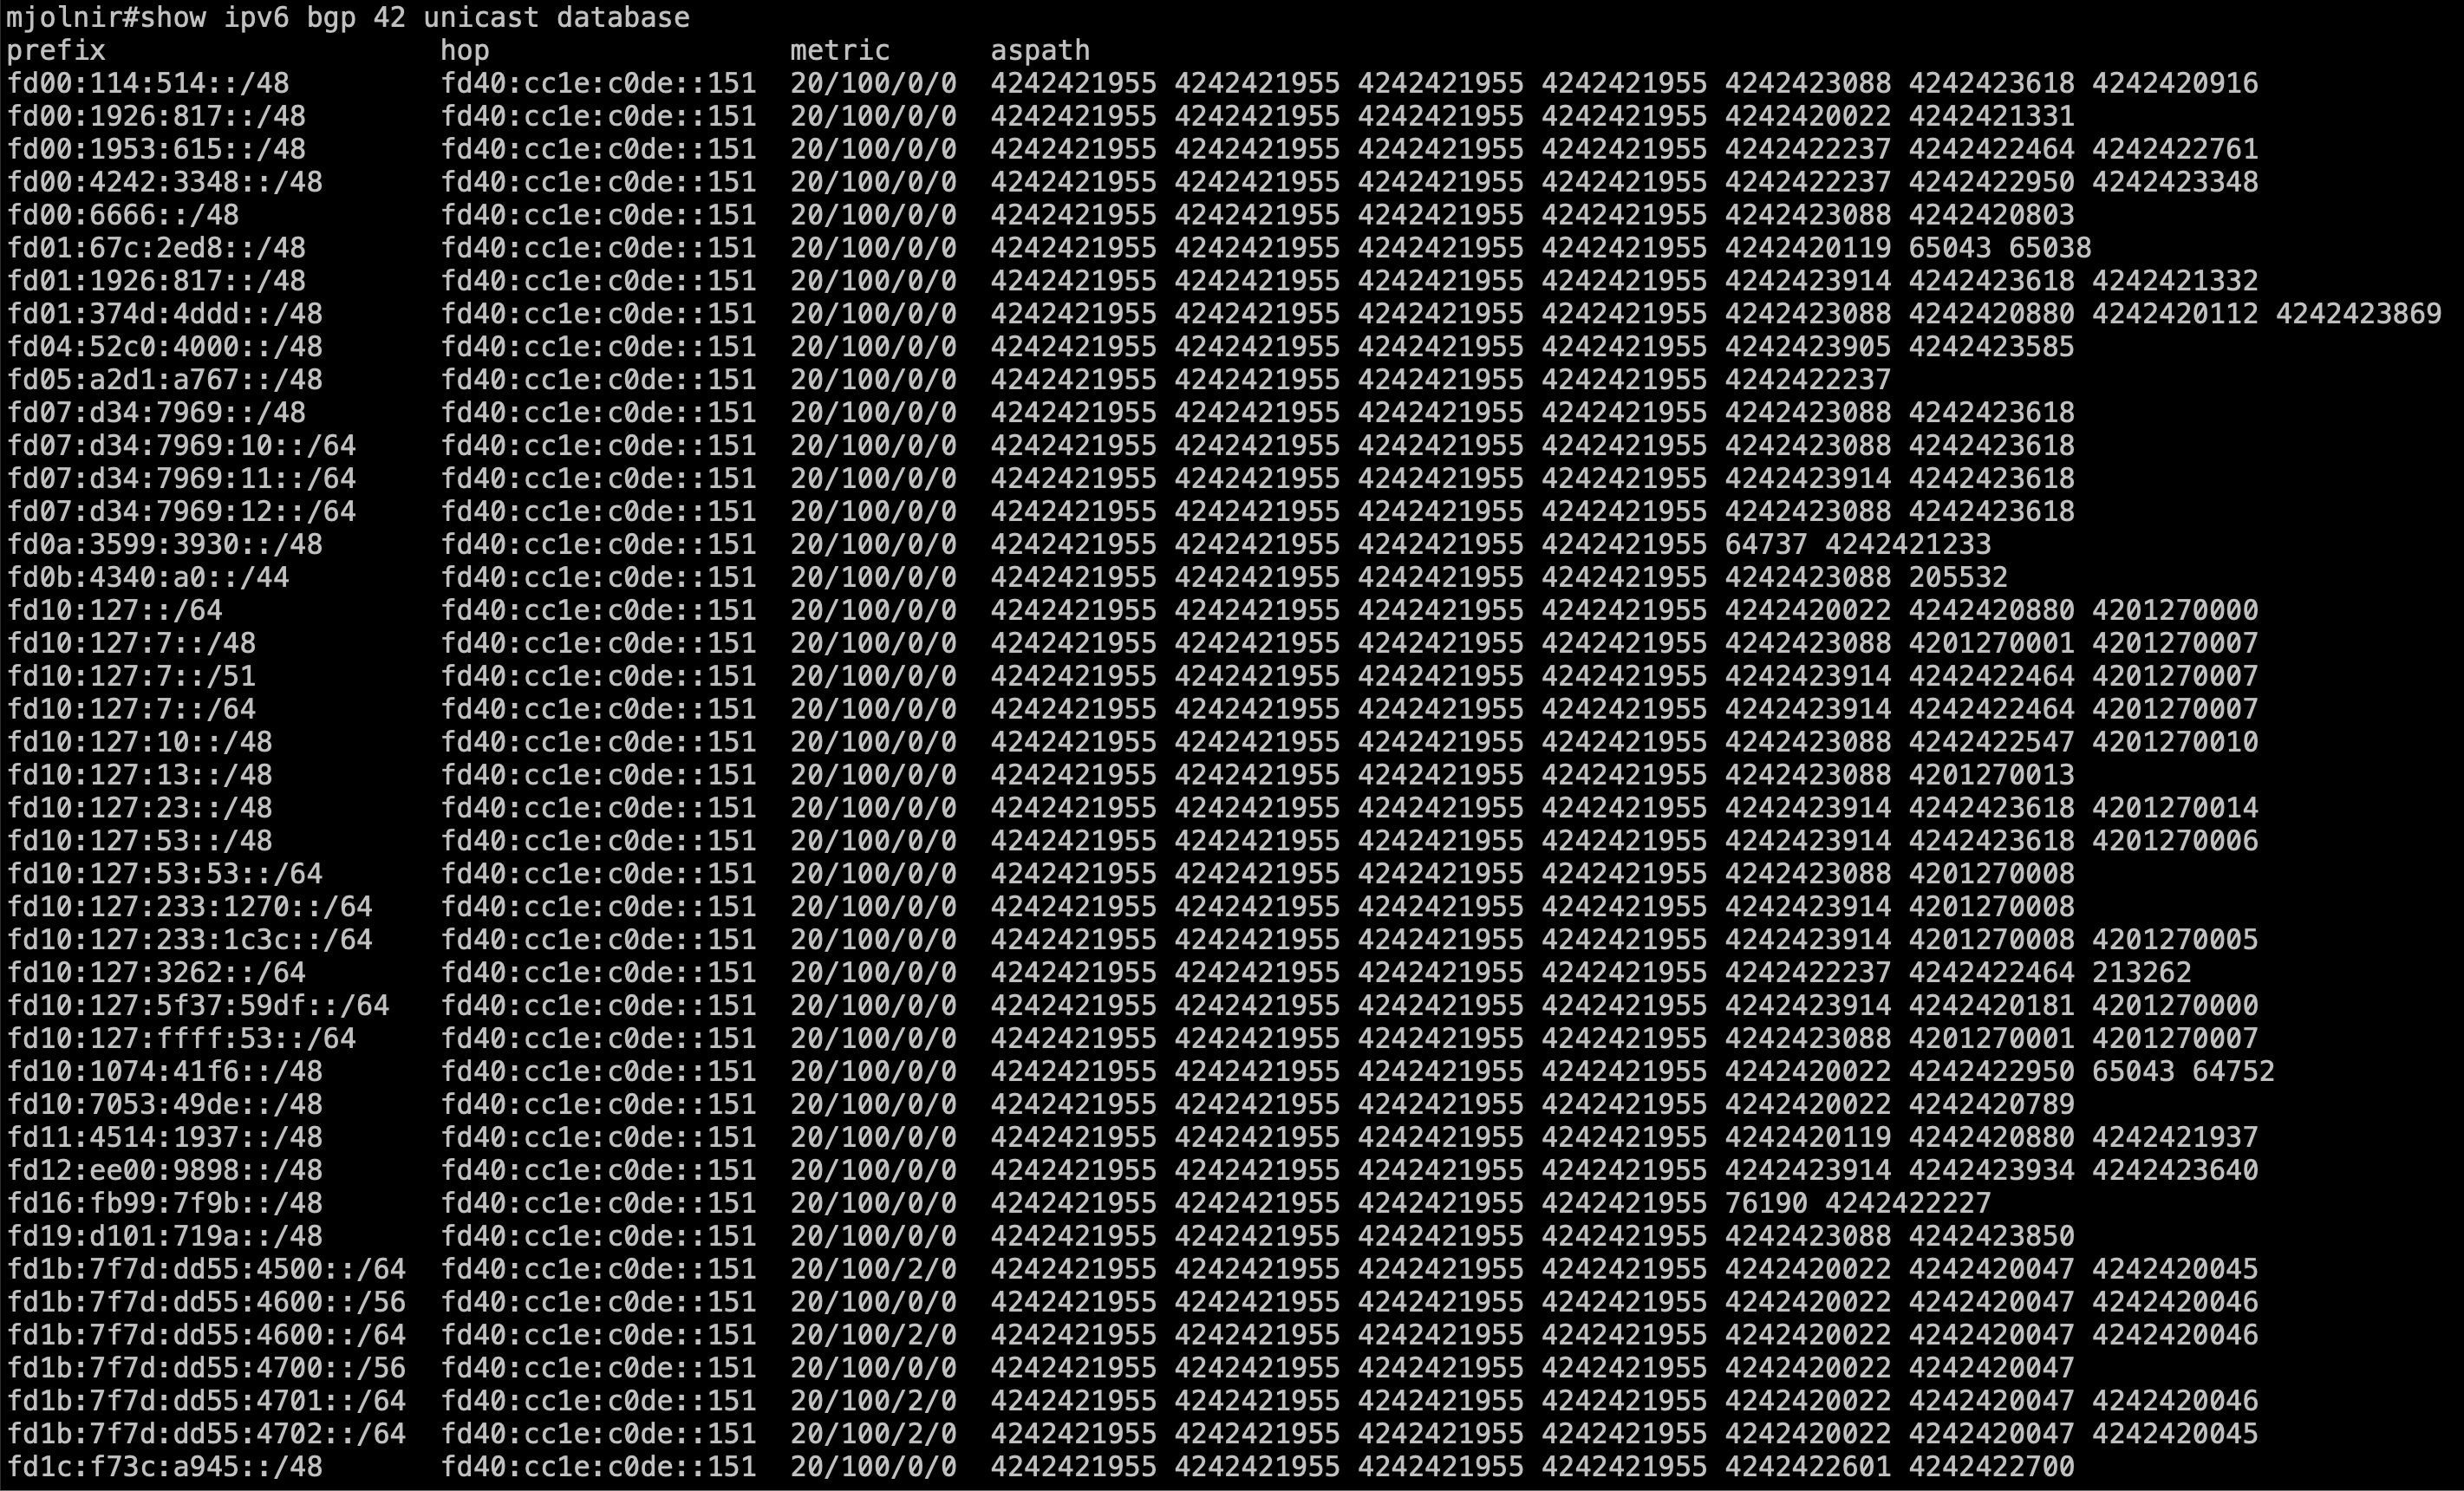
so my screen is too small for all the IPv6 BGP prefix into DN42 VRF As a last example, something we usually do as network operators is to check ongoing interface traffic level: | Code Block |
|---|
| language | bash |
|---|
| theme | Midnight |
|---|
| title | Check interface traffic level (received/transmitted) ) |
|---|
| r1#sh int sdn1
sdn1 is up (since 09:41:21, 2 changes)
description: mjolnir@LAN1[01:00.0]
type is sdn, hwaddr=003b.7671.764f, mtu=1500, bw=8000kbps, vrf=inet
ip4 address=192.168.0.90/24, netmask=255.255.255.0, ifcid=10013
ip6 address=2a01:e0a:159:2850::666/64, netmask=ffff:ffff:ffff:ffff::, ifcid=10013
received 52013 packets (17638316 bytes) dropped 5 packets (448 bytes)
transmitted 80765 packets (15101696 bytes) promisc=false macsec=false
r1#sh int sdn1
sdn1 is up (since 09:41:22, 2 changes)
description: mjolnir@LAN1[01:00.0]
type is sdn, hwaddr=003b.7671.764f, mtu=1500, bw=8000kbps, vrf=inet
ip4 address=192.168.0.90/24, netmask=255.255.255.0, ifcid=10013
ip6 address=2a01:e0a:159:2850::666/64, netmask=ffff:ffff:ffff:ffff::, ifcid=10013
received 52013 packets (17638316 bytes) dropped 5 packets (448 bytes)
transmitted 80766 packets (15101778 bytes) promisc=false macsec=false
r1#sh int sdn1
sdn1 is up (since 09:41:24, 2 changes)
description: mjolnir@LAN1[01:00.0]
type is sdn, hwaddr=003b.7671.764f, mtu=1500, bw=8000kbps, vrf=inet
ip4 address=192.168.0.90/24, netmask=255.255.255.0, ifcid=10013
ip6 address=2a01:e0a:159:2850::666/64, netmask=ffff:ffff:ffff:ffff::, ifcid=10013
received 52015 packets (17638418 bytes) dropped 5 packets (448 bytes)
transmitted 80766 packets (15101778 bytes) promisc=false macsec=false
|
In the last example we repeatedly issue the "sh int sdn1" command and try to see if TX/RX packets counters increment or not. This command can be improved in order to be less chatty: | Code Block |
|---|
| language | bash |
|---|
| theme | Midnight |
|---|
| title | Check interface traffic level (received/transmitted) ) |
|---|
| r1#sh int sdn1 | i received|transmitted
received 52256 packets (17681204 bytes) dropped 5 packets (448 bytes)
transmitted 81130 packets (15162642 bytes) promisc=false macsec=false
r1#sh int sdn1 | i received|transmitted
received 52256 packets (17681204 bytes) dropped 5 packets (448 bytes)
transmitted 81130 packets (15162642 bytes) promisc=false macsec=false
r1#sh int sdn1 | i received|transmitted
received 52260 packets (17681496 bytes) dropped 5 packets (448 bytes)
transmitted 81132 packets (15162790 bytes) promisc=false macsec=false |
Same goes if want want interface traffic for all interface | Code Block |
|---|
| language | bash |
|---|
| theme | Midnight |
|---|
| title | Check interface traffic level (received/transmitted) ) |
|---|
| show interfaces summary
interface state tx rx drop
loopback0 up 65856 0 0
loopback42 up 65856 0 0
ethernet0 up 31071917 33183183 0
hairpin41 up 85806 85552 0
hairpin42 up 85806 85552 0
sdn1 up 15200591 17703953 448
sdn2 up 15563546 8000994 794
sdn3 admin 0 0 0
sdn4 admin 0 0 0
sdn5 admin 0 0 0
sdn6 admin 0 0 0
sdn998 up 5850 0 0
sdn999 up 23268 18666 0
tunnel1965 up 5222281 7124950 0 |
Above was to check interface status related to software switched packet. What if I want to check hardware switched packet counters switched by P4 or DPDK ? | Code Block |
|---|
| language | bash |
|---|
| theme | Midnight |
|---|
| title | Check interface traffic level (received/transmitted) ) |
|---|
| show interfaces hwsummary
interface state tx rx drop
hairpin41 up 0 0 0
hairpin42 up 0 0 0
sdn1 up 317902736 590402538 1162971
sdn2 up 574923844 310497399 203
sdn3 admin 0 0 0
sdn4 admin 0 0 0
sdn5 admin 0 0 0
sdn6 admin 0 0 0
sdn998 up 9062 0 0
sdn999 up 103804 64470 0
tunnel1965 up 0 1301312 0 |
| Tip |
|---|
| As a network operator, the "show" command is your best friend, your wingman. Just explore now from freeRouter CLI using "show ?" and you'll understand the amazing list of diagnosis command available. |
|
...
| Expand |
|---|
|
Last but not list. "differ" , this will split the window in 2 buffers reflecting the same output but with different version and it it signal line lines that have changed. | Code Block |
|---|
| language | bash |
|---|
| theme | Midnight |
|---|
| title | Check BGP best path computation for BGP process 42 |
|---|
| r1#diff ipv4 bgp 42 bestpath
... |
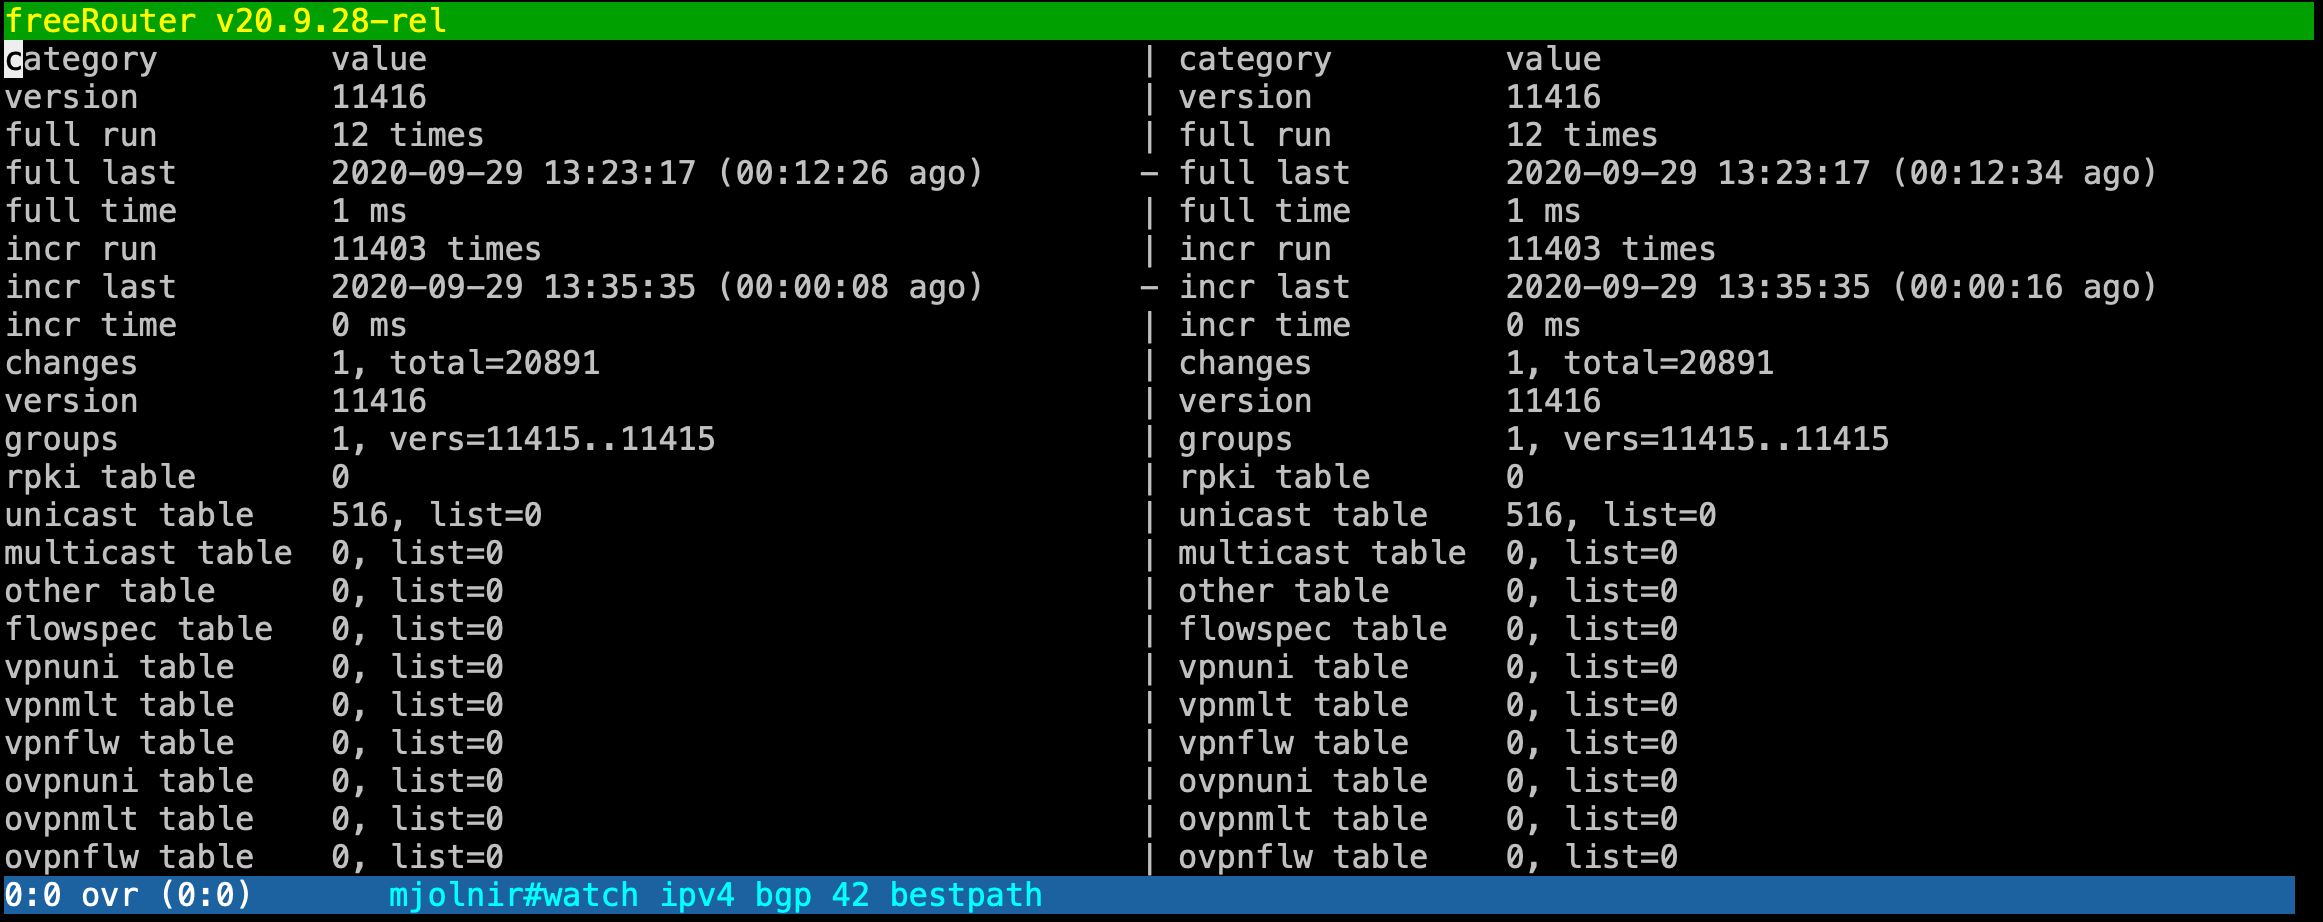
With this view you can easily spot the differences between 2 advertisements interval. To be honest, when i used this feature for the first time I was totally stumbled and said: Waouw ... Simply amazing ... |
Discussion
show/view/watch/display/differ is pretty unique to freeRouter, and is really meant to provide you the best user experience as a network operator ! these command have proven to be helpful, especially if you deal with huge feed. However, be careful when you are working with very big output such BGP full feed. This won't crash the router of course as we used to when we issued "debug ip packet" but it will for sure imply a high CPU usage due to regular refresh at the control plane level.
Conclusion
In this 2nd article:
- We presented freeRouter show/watch/display/differ diagnisis command
- These are very useful when you have to deal with huge command output buffer.
...
