UPDATE ......From Tuesday 8 April 2025 we have changed the way that Single Sign-on works on this wiki. Please see here for more information:
Update
...
cloud@clouddriveTest:~$ time iperf -c clouddriveapp1.du1.cesnet.cz -i 1 -n 1G
------------------------------------------------------------
Client connecting to clouddriveapp1.du1.cesnet.cz, TCP port 5001
TCP window size: 23.5 KByte (default)
------------------------------------------------------------
[ 3] local 195.113.231.237 port 48934 connected with 195.113.231.236 port 5001
[ ID] Interval Transfer Bandwidth
[ 3] 0.0- 1.0 sec 384 MBytes 3.22 Gbits/sec
[ 3] 1.0- 2.0 sec 574 MBytes 4.81 Gbits/sec
[ 3] 0.0- 2.1 sec 1.00 GBytes 4.06 Gbits/sec
real 0m2.144s
user 0m0.016s
sys 0m0.604s
These files were uploaded directly to the CloudDrive application using cadaver WebDAV client.
Side note: You can “script” cadaver, you have to supply the credentials using ~/.netrc file (more info: http://www.mavetju.org/unix/netrc.php) and create a file listing commands you would otherwise type into cadaver’s interactive CLI (--rcfile parameter, more: man cadaver).
The output of the uploads looks like this:
...
As you can see, the application processes the upload at around 7.2Mbytes/s speed. Important thing to note : the application is CPU-bound and during the tests used 99% of available CPU time on the VM.
You can see the system statistics(cpu, i/o, mem, interrupts, context switches and more) captured during the 1GB file upload in the attached dstat.xlsx file (this is cleaned-up csv file generated by dstat).
In an effort to understand why the processing speed is only around 7.2 Mbytes/s I dug deeper. I ran a Java profiler (the CloudDrive application is written in Scala, but it compiles into Java bytecode and is run in the JVM) VisualVM on the running application during the processing/upload of 1GB file.
First things first. Java installed on the application node was openjdk-7-jre. For profiling I ran the application in JVM with these parameters, to enable JMX connections for profiling (more: http://stackoverflow.com/questions/10591463/why-wont-the-visualvm-profiler-profile-my-scala-console-application?rq=1):
...
For profiling I installed VisualVM 1.3.2 and followed this tutorial (http://www.codefactorycr.com/java-visualvm-to-profile-a-remote-server.html) + added JMX connection. From there I captured the metrics for CPU during the processing. Profiler output in XML format is attached.
Also the images of CPU hotspot methods and the Compression class subtree from the profiler are attached. As you can see in the hotspot image, most of the time is spent in compress() method and ++ equals 1.apply (Scala operator method?). In the subtree image you can see these two methods expanded with a part of their call trees.
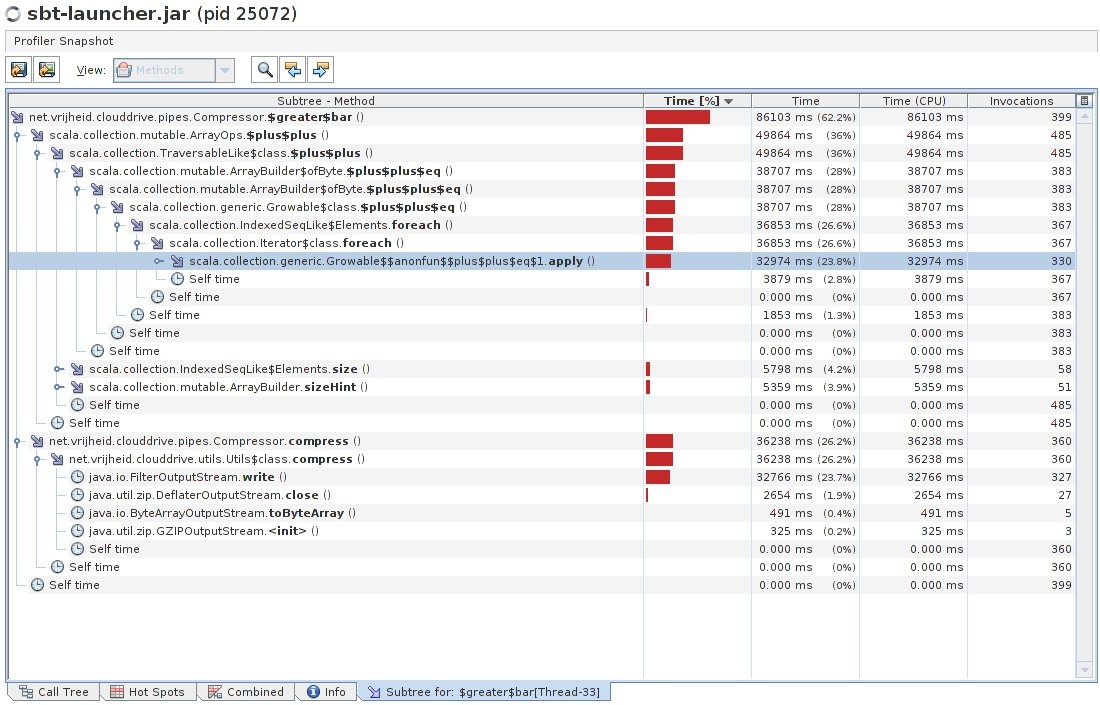
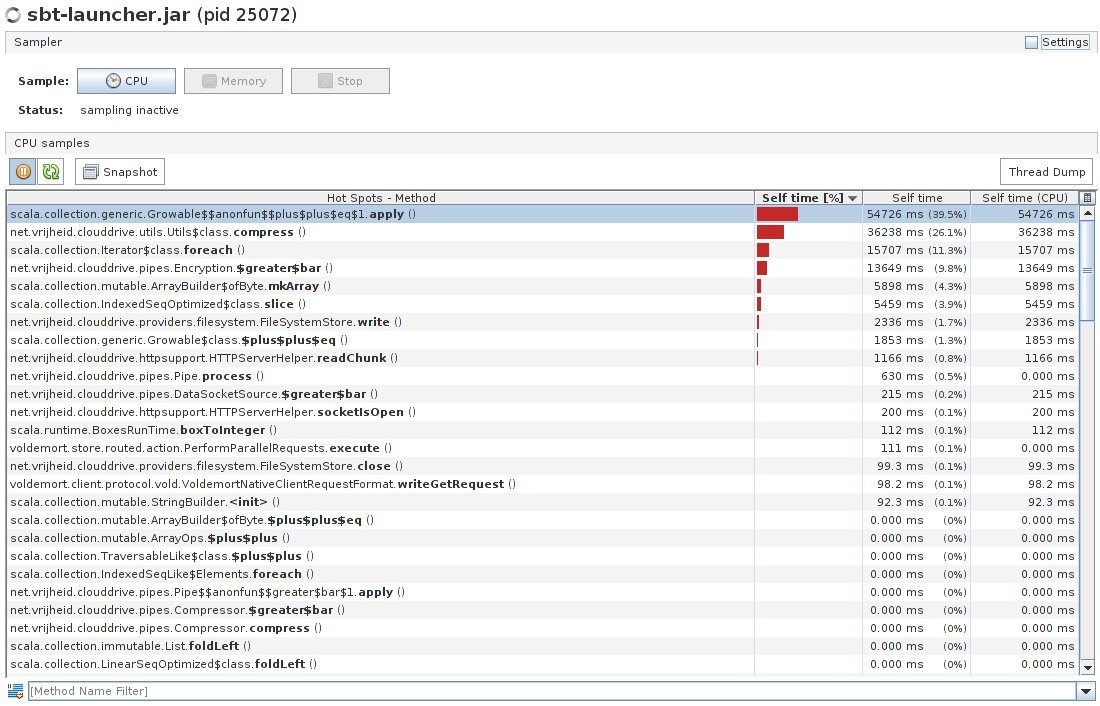
My knowledge of Scala is pretty limited (I am fairly comfortable with Java, but I have no experience with Scala specifics) but from what I could deduce, the hotspots are in “>|” method definition in https://github.com/VirtualCloudDrive/CloudDrive/blob/master/src/clouddrive/src/main/scala/pipes/Compression.scala , which takes care of compressing the data with gzip algorithm. For comparison, when I tried to compress the same files used for application testing, it took less time (obviously, the application has to do encryption on the data and many other tasks):
...