This is a new category of article that falls under "RARE software architecture" special blog series. As its name implies, it deals with topics related to RARE/freeRouter software / Monitoring.
Requirement- Basic Linux/Unix knowledge
- Service provider networking knowledge
|  Image Modified Image Modified
|
Overview
In Greek mythology, Prometheus is a Titan that is credited mankind creation by stealing Fire from Gods and by giving it to human. In the RARE context, Prometheus is a the software from prometheus.io project. It became very popular in the IT industry as it is very simple to implement/configure while providing a great number of metrics without impacting application performance. It is heavily used in microservices environment such as docker and Kubernetes. The mythological reference gives us an indication of how Prometheus is operating. At a constant rate, Prometheus metric collector or server is stealing metrics from Prometheus agent. All the stolen metrics are then consolidated in Time Series database ready to be poured to a queueing system for proper visualization.
Before going further, allow me a brief digression by sharing with you a small anecdote that led leds to this ongoing work related to network monitoring for RARE. As mentioned previously, our focus is to elaborate RARE/freeRouter solution the possibility to be monitored in an operational environment. In that context, we started with the implementation of a lightweight SNMP stack that provided relevant result via SNMP tools like LibreNMS. This is great for organisation that wouldn’t want invest time on anything but SNMP.
...
The answer was: « Let’s give it a try to and fire up a Prometheus and Grafana instance from NMaaS platform !»
Some hacking at the control plane code level were initiated, after few hours freeRouter lead developer came up with a solution and said: Let me introduce you "freeRouter prometheus agent »
...
Why is it important you might say ? It is just that with prometheus simplicity and low resource overhead with have full control plane metrics visibility !
As a side note , this is not a replacement for INT/TELEMETRYTelemetry/NETFLOWNetflow/IPFIX that provide different type of data that are to at the same scale…
People with INT/TELEMETRY/NETFLOW/IPFIX are talking about (disclaimer:buzz word) a "data lake" or "data deluge". Which is correct., if you think about the complexity of resolving a gigantic producer/consumer data problem. This needs the relevant IT infrastructure in order to process all of the data provided by these protocol at the NREN scale.
While in our case, we While in our case, we are just focusing on exposing CONTROL PLANE METRICS (so it is definitely not a lake), but we don’t need a "lake of data" in order to at the network element level. We simply monitor and ensure a router operation .by using prometheus metrics
| Warning |
|---|
|
While he above might be true, the number of metrics exported from a prometheus target can be very high. Fine tuning might be necessary in order to make sure that all metrics are really necessary for network monitoring purpose. This explosion of metrics exposure can add unnecessary workload at the control plane level. |
Again, kudos to NMaaS team that Again, kudos to NMaaS team that made this happen so the that we can could test this on the P4 LAB with — ZERO — effort.
...
| Expand |
|---|
| title | Configure a Prometheus server |
|---|
|
The first step is to implement a prometheus server. Using NMaaS it is pretty instantaneous. However, if you plan to deploy prometheus in an other platform just follow the installation guide here. Once deployed you can push the following prometheus.yaml config: | Code Block |
|---|
| language | yml |
|---|
| theme | Midnight |
|---|
| title | prometheus.yaml |
|---|
| global:
scrape_interval: 15s
evaluation_interval: 30s
alerting:
alertmanagers:
- static_configs:
- targets:
rule_files:
scrape_configs:
- job_name: 'router'
metrics_path: /metrics
scrape_interval: 15s
static_configs:
- targets: ['192.168.0.1:9001','192.168.0.2:9001']
labels: |
In this configuration we assume that we have 2 freeRouters that are configured as above (192.168.0.1:9001 and 192.168.0.2:9001) in prometheus worls these are called targets: - each target are interrogated or "scraped" very "scrap_interval" which is 15s here
- the main job name is called; "router"
- metrics_path is: "/metrics" so the scraped URL is: "http://192.168.0.1:9001/metrics"
Note that this had to be deployed only once for all of your routers. However, each time you'd like to add a new router, you have to add a new target in the "targets" YAML list. |
| Expand |
|---|
| title | Configure Prometheus FreeRouter sensor object on freeRtr control plane |
|---|
|
In this example let's focus our interest interface metrics. Please note that this configuration should be deployed on each freeRouter and connectivity should be available between all targets and the prometheus server. - The objective is to tell freeRouter control plane to expose hardware and software counter interface metric
. In order to do this just copy/paste the stanza here below via freeRouter CLI:- using the sensor object.
- You have 2 types of sensor:
- Universal sensor: Sensor definition that you can cut/paste anywhere
- User specific sensor: Sensor definition that you need to adjust depending freeRTr configuration implemented by user
| Code Block |
|---|
| language | bash |
|---|
| theme | Midnight |
|---|
| title | prometheus interface metric configuration |
|---|
| !
server prometheus <PROMETHEUS_SERVER_NAME>
metric inthw command sho inter hwsumm
metric inthw prepend iface_hw_byte_
metric inthw name 0 ifc=
metric inthw replace \. _
metric inthw column 1 name st
metric inthw column 1 replace admin -1
metric inthw column 1 replace down 0
metric inthw column 1 replace up 1
metric inthw column 2 name tx
metric inthw column 3 name rx
metric inthw column 4 name dr
metric intsw command sho inter summ
metric intsw prepend iface_sw_byte_
metric intsw name 0 ifc=
metric intsw replace \. _
metric intsw column 1 name st
metric intsw column 1 replace admin -1
metric intsw column 1 replace down 0
metric intsw column 1 replace up 1
metric intsw column 2 name tx
metric intsw column 3 name rx
metric intsw column 4 name dr
vrf <VRF_NAME>
exit
!
|
So this basically means: - From freeRouter CLI, issue the following command:
!-------------------------------------------------------------------------------
! Example of universal sensor:
! That can be copy paste as is.
!-------------------------------------------------------------------------------
!
sensor ifaces-hw
path interfaces-hw/interface/counter
prefix freertr-ifaces
key name interfaces-hw/interface
command sho inter hwsumm
prepend iface_hw_byte_
name 0 ifc=
replace \. _
column 1 name st
column 1 replace admin -1
column 1 replace down 0
column 1 replace up 1
column 2 name tx
column 3 name rx
column 4 name dr
.
exit
!
!-------------------------------------------------------------------------------
! Example of sensor you need to adjust:
! You need to adapt your BGP process number:
! Here replace 65535 by your BGP process number)
!-------------------------------------------------------------------------------
!
sensor bgp4peer
path bgp4/peer/peer
prefix freertr-bgp4peer
key name bgp4/peer
command sho ipv4 bgp 65535 summ
prepend bgp4_peer_
name 0 peer=
replace \. _
column 2 name state
column 2 replace false 0
column 2 replace true 1
column 3 name learn
column 4 name advert
.
exit
! |
So this basically means: - From freeRouter CLI, issue the following command:
| Code Block |
|---|
| language | bash |
|---|
| theme | Midnight |
|---|
| title | prometheus interface metric configuration |
|---|
| sho inter hwsumm
interface state tx rx drop
hairpin41 up 67404 0 0
hairpin42 up 153134 0 0
sdn1 up 412319805 1057514903 1152305
| | Code Block |
|---|
| language | bash |
|---|
| theme | Midnight |
|---|
| title | prometheus interface metric configuration |
|---|
| sho inter hwsumm
interface state tx rx drop
hairpin41 up 67404 0 0
hairpin42 up 153134 0 0
sdn1 up 412319805 1057514903 1152305
sdn2 up 1038840147 407307558 202
sdn3 admin 0 0 0
sdn4 admin 0 0 0
sdn5 admin 0 0 0
sdn6 admin 0 0 0
sdn998 up 9154 0 0
sdn999 up 199178 262939 0
tunnel1965 up 0 9122896 0 |
- prepend to the metric name: "iface_hw_byte_"
- column 0 will have prometheus label ifc=
- replace all dots "." by "_" . (so interface bundle1.123 will become bundle1_123)
- column 1 defines a metric name "iface_hw_byte_" concatenated to "st" => "iface_hw_byte_st" which is essentially interface status
- if column 1 "state" value is admin/down/up we associate value -1/0/1
- column 2 defines a metric name "iface_hw_byte_" concatenated to "tx" => "iface_hw_byte_tx" which is essentially interface bytes transmitted counter
- column 3 defines a metric name "iface_hw_byte_" concatenated to "rx" => "iface_hw_byte_rx" which is essentially interface bytes received counter
column 4 defines a metric name "iface_hw_byte_" concatenated to "dr" => "iface_hw_byte_dr" which is essentially interface bytes dropped counter - 1 "state" value is admin/down/up we associate value -1/0/1
- column 2 defines a metric name "iface_hw_byte_" concatenated to "tx" => "iface_hw_byte_tx" which is essentially interface bytes transmitted counter
- column 3 defines a metric name "iface_hw_byte_" concatenated to "rx" => "iface_hw_byte_rx" which is essentially interface bytes received counter
- column 4 defines a metric name "iface_hw_byte_" concatenated to "dr" => "iface_hw_byte_dr" which is essentially interface bytes dropped counter
- Then you need to bind the configured sensor to prometheus server:
| Code Block |
|---|
| language | bash |
|---|
| theme | Midnight |
|---|
| title | prometheus interface metric configuration |
|---|
|
!-------------------------------------------------------------------------------
! Example of Prometheus agent configuration
! And sensor bindings
!-------------------------------------------------------------------------------
!
server prometheus pr
 sensor ifaces-hw
 sensor bgp4peer
 interface <prometheus_agent_interface_binding>
 vrf <prometheus_agent_vrf_bingind>
 exit
! |
And if you followed this correctly, we are repeating these lines for software interface counter metric. | Tip |
|---|
| You can view Prometheus configuration for various Grafana dashboard here. Feel free to study these Prometheus configuration and activate them as you see fit depending on your requirements. The set of dashboard is not exhaustive and is by no means absolute. Feel free to submit additional dashboard ! We would gladly add them in the current list of freeRouter Dashboard. |
| Warning |
|---|
| After this definition a freeRouter level you should have: 4 metrics related to hardware counters - iface_hw_byte_st
- iface_hw_byte_tx
- iface_hw_byte_rx
- iface_hw_byte_dr
4 metrics related to software counters - iface_sw_byte_st
- iface_sw_byte_tx
- iface_sw_byte_rx
- iface_sw_byte_dr
Which is a total of 8 metrics |
| Tip |
|---|
| From that point you can check via prometheus console: 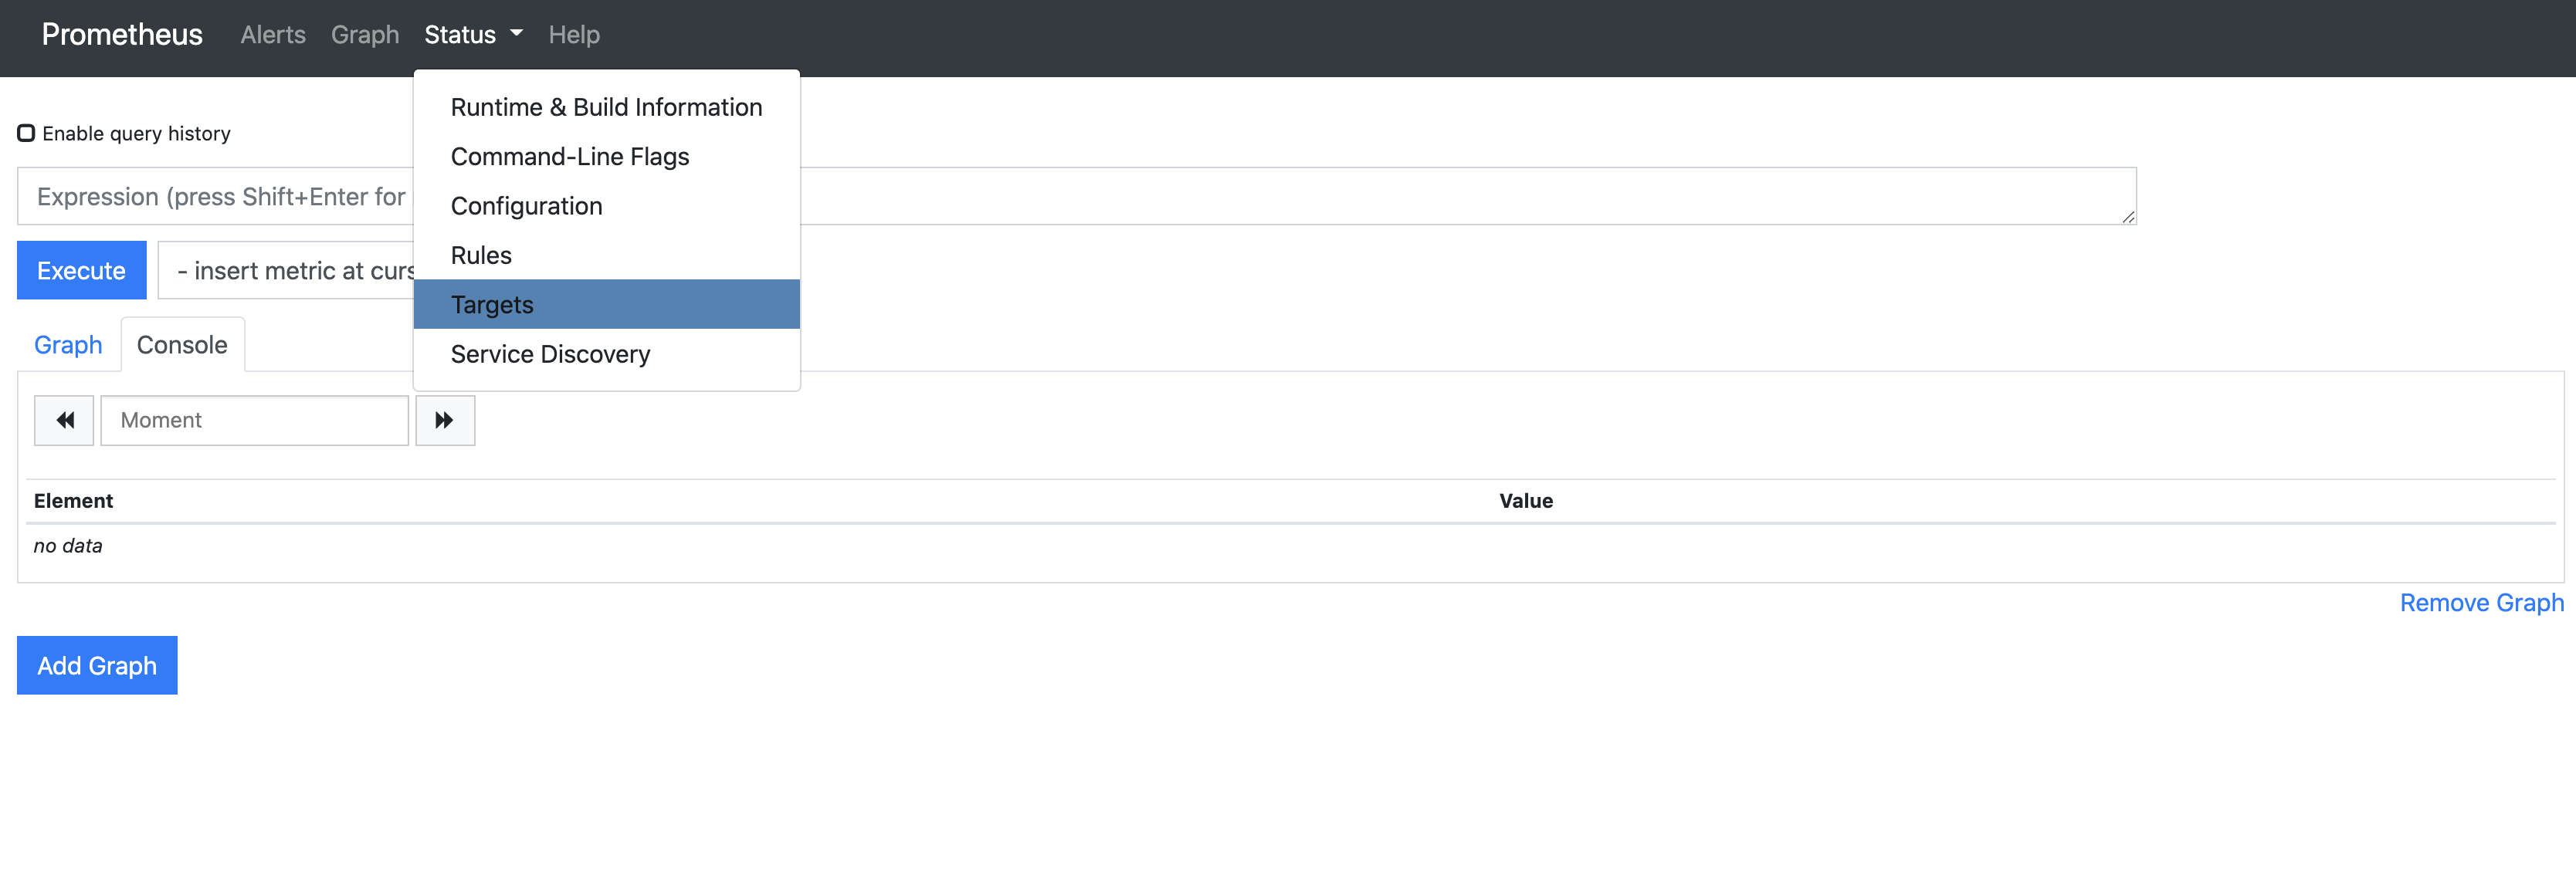
|
check the "Targets" menu drop down selection 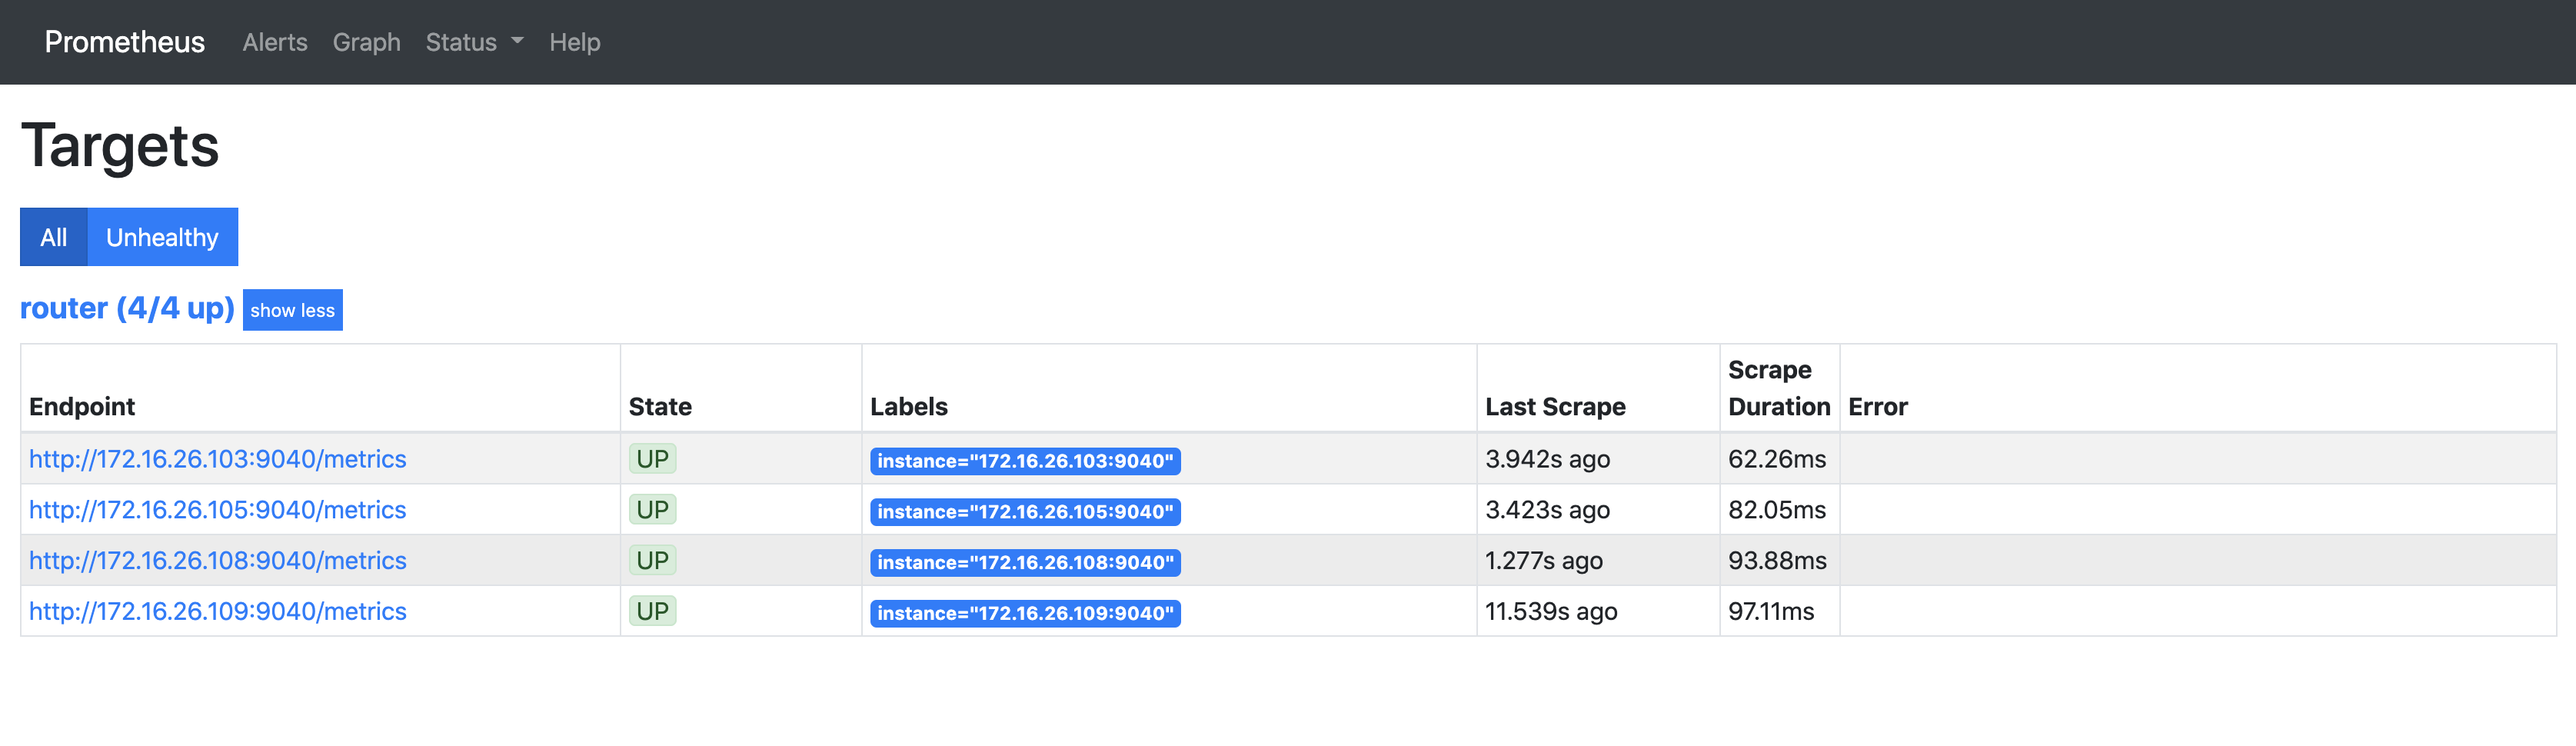
From that point you should be able to use PromQL query filed in order to check that you can retrieve the metrics we defined above. |
...
- "show interface hwsummary"
- or "show interface swsummary".interface swsummary".
However some metrics cannot be retrieved by generic interface. Some There will be some times when some metrics will be tied to specificities of your network. These can be the AS number, IGP process name, VRF name etc.
Let me give you a couple of exampleexamples:
| Expand |
|---|
| title | the metrics below assume that you have deployed a link state IGP called: "isis 1" or in your case |
|---|
|
But your network context you could have arbitrary deployed "isis 2200". (2200 is RENATER AS number) | Code Block |
|---|
| language | bash |
|---|
| theme | Midnight |
|---|
| title | prometheus Sensor interface metric for link state protocol configuration |
|---|
| metric lsigp4int sensor lsigp4int
path lsigp4int/peer/peer
prefix freertr-lsigp4int
key name lsigp4int/peer
command sho ipv4 isisospf 1 interface
metric lsigp4int prepend lsigp4_iface_
metric lsigp4int name 0 proto="isis1ospf1",ifc=
metric lsigp4int replace \. _
metric lsigp4int column 1 name neighbors
.
metric lsigp4peer exit
sensor lsigp4peer
path lsigp4peer/peer/peer
prefix freertr-lsigp4peer
key name lsigp4peer/peer
command sho ipv4 isisospf 1 topology 2
0 metric| lsigp4peerinc reach
prepend lsigp4_peers_
metric lsigp4peer
name 0 proto="isis1ospf1",node=
replace \. _
column 2 name reachable
metric lsigp4peer replace \. _
metric lsigp4peer column 1 name reachable
metric lsigp4peer column 1 replace false 0
metric lsigp4peer column 1 replace true 1
metric lsigp4peer column 6 name neighbors
metric lsigp4perf command sho ipv4 isis 1 spf 2 | inc reachable|fill|calc|run
metric lsigp4perf prepend lsigp4_perf_
metric lsigp4perf labels proto="isis1"
metric lsigp4perf skip 0
metric lsigp4perf column 1 name val
metric lsigp6int command sho ipv6 isis 1 interface
metric lsigp6int prepend lsigp6_iface_
metric lsigp6int column 2 replace false 0
column 2 replace true 1
column 3 name neighbors
.
exit
sensor lsigp4perf
path lsigp4perf/peer/peer
prefix freertr-lsigp4perf
key name lsigp4perf/peer
command sho ipv4 ospf 1 spf 0 | inc reachable|fill|calc|run
prepend lsigp4_perf_
labels proto="ospf1"
skip 0
column 1 name val
.
exit
sensor lsigp6int
path lsigp6int/peer/peer
prefix freertr-lsigp6int
key name lsigp6int/peer
command sho ipv6 ospf 1 interface
prepend lsigp6_iface_
name 0 proto="ospf1",ifc=
replace \. _
column 1 name neighbors
.
exit
sensor lsigp6peer
path lsigp6peer/peer/peer
prefix freertr-lsigp6peer
key name lsigp6peer/peer
command sho ipv6 ospf 1 topology 0 | inc reach
prepend lsigp6_peers_
name 0 proto="isis1ospf1",ifcnode=
replace metric lsigp6int \. _
replace \./ _
column metric2 lsigp6intname reachable
column 2 replace false 0
column 2 replace true 1
column 3 name neighbors
.
exit
metric lsigp6peer sensor lsigp6perf
path lsigp6perf/peer/peer
prefix freertr-lsigp6perf
key name lsigp6perf/peer
command sho ipv6 isisospf 1 topologyspf 2
0 metric| lsigp6peer name 0 proto="isis1",node=
metric lsigp6peer inc reachable|fill|calc|run
prepend lsigp6_peersperf_
metric lsigp6peer replace \. _
metric lsigp6peer labels proto="ospf1"
skip 0
column 1 name reachable
metric lsigp6peer column 1 replace false 0
metric lsigp6peer column 1 replace true 1
metric lsigp6peer column 6 name neighbors
metric lsigp6perf command sho ipv6 isis 1 spf 2 | inc reachable|fill|calc|run
metric lsigp6perf prepend lsigp6_perf_
metric lsigp6perf labels proto="isis1"
metric lsigp6perf skip 0
metric lsigp6perf column 1 name valval
.
exit
sensor lsigp4metric
path lsigp4metric/peer/peer
prefix freertr-lsigp4metric
prepend lsigp4_metric_
command show ipv4 ospf 1 metric
name 0 proto="ospf1",ifc=
key name lsigp4metric/peer
replace \. _
column 4 name metric
.
exit
sensor lsigp6metric
path lsigp6metric/peer/peer
prefix freertr-lsigp6metric
prepend lsigp6_metric_
command show ipv6 ospf 1 metric
name 0 proto="ospf1",ifc=
key name lsigp6metric/peer
replace \. _
column 4 name metric
.
exit |
|
| Expand |
|---|
| title | in the metric below the variable is BGP AS number "65535": |
|---|
|
| Code Block |
|---|
| language | bash |
|---|
| theme | Midnight |
|---|
| title | prometheus interface metric configuration |
|---|
| metric bgp4peer sensor bgp4peer
path bgp4/peer/peer
prefix freertr-bgp4peer
key name bgp4/peer
command sho ipv4 bgp 65535 summ
metric bgp4peer prepend bgp4_peer_
metric bgp4peer name 40 peer=
metric bgp4peer replace \. _
metric bgp4peer column 12 name learnstate
metric bgp4peer column 2 replace namefalse advert0
column metric2 bgp4peerreplace column 3 name state
metric bgp4peer true 1
column 3 replacename false 0
metric bgp4peer learn
column 34 replace true 1
metric bgp4perf name advert
.
exit
sensor bgp4perf
path bgp4/perf/perf
prefix freertr-bgp4perf
key name bgp4/perf
command sho ipv4 bgp 65535 best | exc last
metric bgp4perf prepend bgp4_perf_
metric bgp4perf replace \s _
metric bgp4perf column 1 name val
metric bgp6peer column 1 name val
.
exit
sensor bgp6peer
path bgp6/peer/peer
prefix freertr-bgp6peer
key name bgp6/peer
command sho ipv6 bgp 65535 summ
metric bgp6peer prepend bgp6_peer_
metric bgp6peer name 40 peer=
metric bgp6peer replace \: _
metric bgp6peer column 1 name learn
metric bgp6peer column 2 name advert
metric bgp6peer column 3column 2 name state
column metric2 replace bgp6peerfalse 0
column 32 replace falsetrue 01
column metric3 bgp6peername learn
column 3 replace true 1
metric bgp6perf name advert
.
exit
sensor bgp6perf
path bgp6/perf/perf
prefix freertr-bgp6perf
key name bgp6/perf
command sho ipv6 bgp 65535 best | exc last
metric bgp6perf prepend bgp6_perf_
metric bgp6perf _
replace \s _
metric bgp6perf column 1 name val
.
exit |
|
| Expand |
|---|
| title | Last example with "LDP null" metrics, in this particular case the variable object is the VRF name: "inet" |
|---|
|
| Code Block |
|---|
| language | bash |
|---|
| theme | Midnight |
|---|
| title | prometheus interface metric configuration |
|---|
| metric ldp4nul sensor ldp4nul
path ldp4nul/peer/peer
prefix freertr-ldp4nul
key name ldp4nul/peer
command sho ipv4 ldp inet nulled-summary
metric ldp4nul prepend ldp4null_
metric ldp4nul name 3 ip=
metric ldp4nul skip 2
metric ldp4nul replace \. _
metric ldp4nul column 0 name prefix_learn
metric ldp4nul column 1 name prefix_advert
metric ldp4nul column 2 name prefix_nulled
.
exit
metric ldp6nul
sensor ldp6nul
path ldp6nul/peer/peer
prefix freertr-ldp6nul
key name ldp6nul/peer
command sho ipv6 ldp inet nulled-summary
metric ldp6nul prepend ldp6null_
metric ldp6nul name 3 ip=
metric ldp6nul skip 2
metric ldp6nul replace \: _
metric ldp6nul column 0 name prefix_learn
metric ldp6nul column 1 name prefix_advert
metric ldp6nul column 2 name prefix_nulled
.
exit |
|
Conclusion
In this 1st article, you were presented :
...
| Tip |
|---|
|
In Prometheus philosophy, normally the user should do only the minimum of tweaking regarding configuration. Ultimately, he should be only be able to enable a metric or simply disable it if the scrape cost is too high. However in freeRouter/Prometheus integration process, you see that some metric are issued using specific $variable (VRF, BGP/IGP process number ...) Which makes impossible to maintain this universality. However, from the network operator point of view this should not be a showstopper. On the contrary, it is a powerful choice to be able to alter these command via $variables. Remember in freeRouter philosophy you can have multiple VRF, multiple IGP and multiple BGP process number ! (Which is not the case for all routing platform) Last but not least, this Prometheus agent was developed quickly because of one reason, all the objects at the control plane level were already well structured in table form as previously described in this article. So implementing this table row/column logic in order to derive a prometheus metric was technically possible without too much hassle. |