UPDATE ......From Tuesday 8 April 2025 we have changed the way that Single Sign-on works on this wiki. Please see here for more information:
Update
Table of Contents
Introduction
Performance tests are conducted for Up2U tools to check the responsiveness of Toolbox services under a large synthetic traffic load that simulates a large number of active users. Load tests are aimed at checking how a service performs under a specific expected traffic load. Stress tests focus on identifying the upper capacity limits of current deployments.
All performance tests are currently based on the assumption that a single Toolbox instance must be able to handle 500 assigned schools with ca. 100 users per school. DoW considers 1500 pilot schools at the end of the project, however not all pilot schools will use the same central instance of the Toolbox.
Estimations
In load tests, web service’s behaviour under a specific traffic load, i.e. a set of concurrent distributed HTTP requests, is analysed. Even knowing the number of users, the size of such a request set is not straightforward and requires some estimations and assumptions. The estimations are needed in order to identify a mapping between the number of users and numbers of HTTP requests received by particular tools. HTTP requests for site contents or for API, not for static assets (e.g. CSS/JS), are considered.
Our assumptions are the following:
Schools | 500 |
Users per school (average) | 100 |
Teachers per school | 10 |
Time range per day when the Toolbox is actively used (so-called daylight hours’) | 7am - 9pm, i.e. 14 hours |
Hours of use of the Toolbox per user per week | 6 |
In addition, we assume that the distribution of user activities among working hours is more or less constant. In the first half of a day, users mostly use the Toolbox at schools, and in the second half, they mostly do they homework (students) or prepare some materials (teachers).
Based on these assumptions, we can make some further calculations:
All users | 50,000 |
Working hours in a week | 70 (5 x 14) |
Active users per a working hour | 4,286 (50,000 x 70 / 6) |
Next, depending on a tool, the number of concurrent requests per minute varies as they are different use cases of work with particular tools, and the use cases map to number of HTTP requests in various ways. Thus, we estimate how many minutes pass between subsequent requests from the same users during his/her hours of activeness. These predictions are based on service access logs.
The third columns below present calculation result based on all these assumptions.
| Tool | Average delays between requests from the same user (in minutes) | Average number of requests per minute |
Moodle | 2 | 2143 |
CERNBox | 4 | 1071 |
SelCont | 30 | 143 |
KnockPlop | 30 | 143 |
eduOER | 30 | 143 |
SWAN | - | - |
SWAN is considered as a special case as it scales very well with increasing number of user requests. User requests to SWAN cannot be considered in the same way as for other services, as they result in various complex estimations on server side. The way SWAN is scaled up in terms of such computing power is presented in Deliverable D7.2.
The aforementioned analysis enables us to simulate appropriate average numbers of requests per minute that map to some estimated numbers of users.
Design of Tests
Load tests are performed for all services, together with stress tests for more important components such as the LMS, as it is a router between other components.
During the performance tests, measurements of underlying infrastructure cover the utilisation of CPU, memory, hard disk bandwidth, number of MySQL queries (if relevant), and network bandwidth in order to identify bottlenecks in handling incoming traffic, where bad responsiveness is an issue. The particular measures are taken with the following Linux tools:
CPU and memory – top
Hard disk bandwidth – iostat
MySQL queries – tracking differences of the global MySQL server variable ‘Queries’
Network bandwidth – iftop
The performance tests are conducted at the central Up2U instance hosted by GRNET, GWDG, and PSNC.
The synthetic load was generated using the following tools (i.e. each test case has been repeated using all the tools):
Loader.io – https://loader.io/
Load Impact – https://loadimpact.com.com/
Flood – https://flood.io/
A script performing HTTP requests, run in PSNC infrastructure
Apart from the last tool, the others have been chosen from cloud-based load testing tools, considering highest available limits in free usage plans.
Test cases have lasted for a few minutes. The setup of test cases was meant to comply with the estimations of average number of requests per minute.
Numbers of requests per second have varied among time. Please note that each HTTP request needs also to last for some time, a few seconds usually. Numbers of active, i.e. started but not finished, HTTP requests per second have reached up to 600% of average distribution of requests within one minute.
Requests for static assets (e.g. CSS/JS) are not considered because usual page loads by users do not need to query them as they are fetched in the beginning of interaction and then cached by the web browser in most cases.
Results
No significant differences in obtained results have been noted among the testing tools.
In no test cases, network bandwidth and memory usage has been noted as problematic. The considered numbers of users are not expected to generate load that would be problematic for our network setup and memory limits assigned to particular virtual machines.
The specific results for particular tools are presented in the following subsections.
Moodle
Running the load test of the assumed size, i.e. 2143 requests per minute, shows good responsiveness and no errors from the user perspective. This test confirms that the service is ready for the estimated number of users.
The hard disk utilisation reported during the whole test case was up to 10%.
The diagram shows numbers of active requests (‘clients’), i.e. the green mark with values on the right side, and average response time, i.e. the blue mark with values on the left side. The longest response times were about 4 seconds but during the most of the test case, the times were below 1 second.

However, an increase of the number of requests per minute is considered an important stress test for Moodle. Such a case has revealed bad responsiveness, observed as 40% of requests taking more than 10 seconds, and a bottleneck in CPU utilisation when the instance gets 6000 requests per minute. In this case, hard disk utilisation went up to 18%.
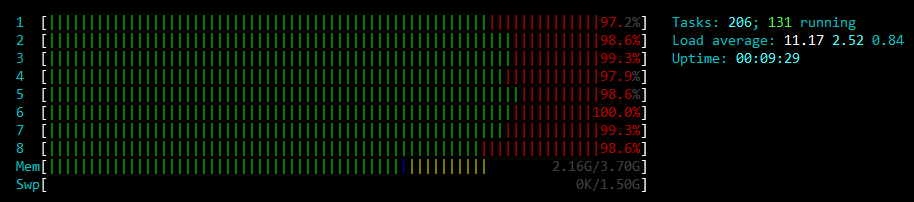
We have also tested a mitigation for this case by increasing the number of CPU cores for this particular virtual machine, from 4 to 8 cores. When the instance is resized from four to eight CPU cores, it performs well again under the latter stress test, although all the CPU power is utilised, as it can be seen in the following figure.
CERNBox
Running the load test of the assumed size, i.e. 1071 requests per minute, shows increased response times of 7-10 seconds. The server-side measurements show CPU utilisation of 40% and HDD utilisation of 32% on average on the Kubernetes node hosting cernbox and cernbox-mysql pods. Other nodes, including the node hosting cernbox-gateway in the front and EOS nodes, were not significantly affected.
Possible bottlenecks causing the increased response times should be further investigated. A possible tool for that could be a comprehensive monitoring system that would tracks all the relevant metrics from all Kubernetes nodes in an online mode.
SeLCont
Running the load test of the assumed size, i.e. 143 requests per minute, shows good responsiveness and no errors from the user perspective. This test confirms that the service is ready for the estimated number of users.
No bottlenecks have been observed in the server-side measurements.
Knockplop
Running the load test of the assumed size, i.e. 143 requests per minute, shows good responsiveness and no errors from the user perspective. This test confirms that the service is ready for the estimated number of users.
No bottlenecks have been observed in the server-side measurements.
It is considered expected as the architecture of this tool is that it’s a stateless services just serving static assets. The audio-video contents is transported via peer-to-peer connections between participants of virtual calls, so the servers are not influenced by such traffic.
We have tried also to conduct a stress tests but free plans of tools in use have not allowed us to generate a load that makes problems to the service. The largest test case tried is 10,000 requests per minute.
EduOER
Running the load test of the assumed size, i.e. 143 requests per minute, shows good responsiveness and no errors from the user perspective. This test confirms that the service is ready for the estimated number of users.
No bottlenecks have been observed in the server-side measurements.
Conclusion
The conducted performance tests have shown how the deployment of the Toolbox is prepared for scaling up the pilots. For all considered traffic load estimates, the Toolbox can perform well just with proper adjustment to components of the underlying infrastructure such as CPU cores and available memory. In case of more serious loads and a higher numbers of users, a mitigation action would be scaling a service up in terms of its deployment architecture, for instance by replicating bottleneck service’s components. The mitigation actions are considered for particular services in Deliverable D7.2TODO: Assumptions and results of our performance tests to be published here.