Timemap
is a tool for network engineers to get insight into latency and jitter behaviour on the network. This is especially important for low latency applications such as LoLa [LoLa-Connect]. LoLa was designed for musicians who would like to play remotely together in live performances but also to support remote teaching and encourage new international collaborations between conservatories. As low latency applications require a reduction of distance-related latency and jitter up to an imperceptible level (for LoLa and similar real-time applications latency should not exceed 30ms one way between participants, and jitter should be 1.5ms or ideally under 1ms), it is imperative for network engineers to have access to such a latency and jitter weather map to be able to monitor and identify any changes in these network parameters that could affect application experience.
We welcome approaches from NRENs who would like to implement this in their backbones!
For more information please contact:
For documentation please go to https://gitlab.geant.org/gn4-3-wp6-t1-lola/timemap_public
The repository contains the sources and the configuration files to set up the Timemap monitoring service. You can also find
- User guide
- Admin guide
- Customisation guide
The official deployment for GN4-3 is available at https://timemap.geant.org (access restricted to NREN community).
Come see us at the GARR booth and follow our live demo!
Network incident detection for real time applications thanks to artificial intelligence at TNC22
Real time applications have specific network requirements regarding latency and Jitter. Detecting excessive jitter variation that would have a dramatic impact on real-time applications to the point of making them inoperable is a key service for users of these applications. A new tool providing hop-by-hop jitter and latency, Timemap, addresses this need using artificial intelligence to detect such incidents. If you would like to see Timemap in action, please come to the GARR booth to see demonstration and talk to the designer of this tool at TNC22 in Trieste. Looking forward to seeing you at Trieste!
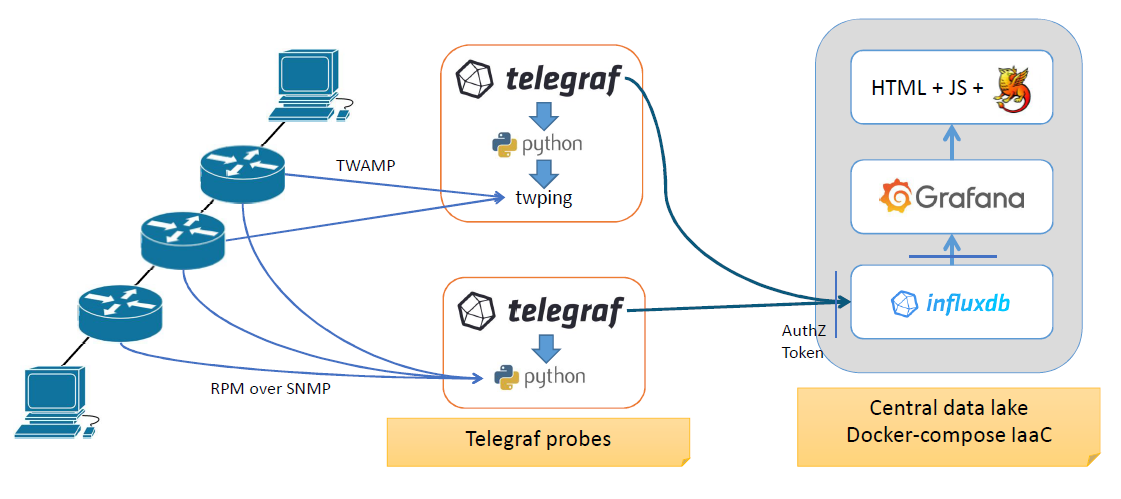
Timemap v.1 main features
Latency & Jitter data collection
- RPM/SNMP from all GÈANT routers
- TWAMP from perfSONAR VM @ JISC w/ routers subset
Simplicity
- Docker + standard Linux packages, almost zero custom code
Security and flexibility
- eduGAIN federated authentication
- RBAC and multi-tenancy in Grafana and InfluxDB
- R/W authorization token for APIs
Timemap - v1 architecture
Interactions with the GUI
Interactions on the GUI are done by selecting an element and right-clicking on it to have the context menu pop-up. By selecting a link and opening the context menu, data visualizations on the collected metric are shown. Just drag the mouse pointer on the chosen metric, a new browser tab with the related time-series will open. Link metrics are collected using RPM SNMP probes. In the same way, by right-clicking on a node the available metric visualizations will be shown. Node metrics are collected using TWAMP data probes.
By right-clicking on the background of the topology, a menu showing information about Timemap and the overall link to the embedded Grafana platform appears.
Each metric collected by Timemap have a Grafana visualization that the user can navigate to get details. Details on a specific time interval are visible by dragging with a mouse over a portion of the reported time range. For more details on the actions that you can perform over the visualizations, please refer to the official Grafana documentation.


