SonarQube (SQ) is an analysis tool aimed at performing automated code reviews based on static code analysis, and supporting expert reviewers in manual reviews. The WP9 T2 team maintains an instance of SQ available at https://sonarqube.software.geant.org and offers software development teams in GÉANT a variety of services based on SonarQube capabilities. In the cover folder Software Reviews we describe the types of reviews offered by the WP9 T2 team.
A number of manuals describing typical SQ use cases (such as the procedure for entering a development project into SQ) is described here.
In this document, we briefly provide an overview of capabilities and functions provided by SonarQube, that could be used by code reviewers (subject-matter experts, SMEs) in performing the reviews requested by software development teams.
Introduction
SQ analyzes the software projects with respect to five main quality characteristics and their corresponding flaws:
- reliability (bugs)
- vulnerabilities
- security hotspots
- maintainability (technical debt and code smells)
- code coverage
- duplications
Each type of the flaw is reported separately and can be analyzed in a different way.
Navigating in SQ
Overview screen
After selecting a project, SQ presents an Overview screen, which provides the core data for each of the characteristics described above.
The Overview screen lets one choose between the New Code tab and the Overall Code tab. Perhaps most importantly the Quality Gate Status (Passed or Failed) is being displayed in the top left corner. The Quality Gate is a set of rules that are either met or failed in a specific point in time during project development. If all rules are met, the Quality Gate return with a positive result. Since the rules can be freely adjusted, SonarQube allows to customize the Quality Gate to the project needs.
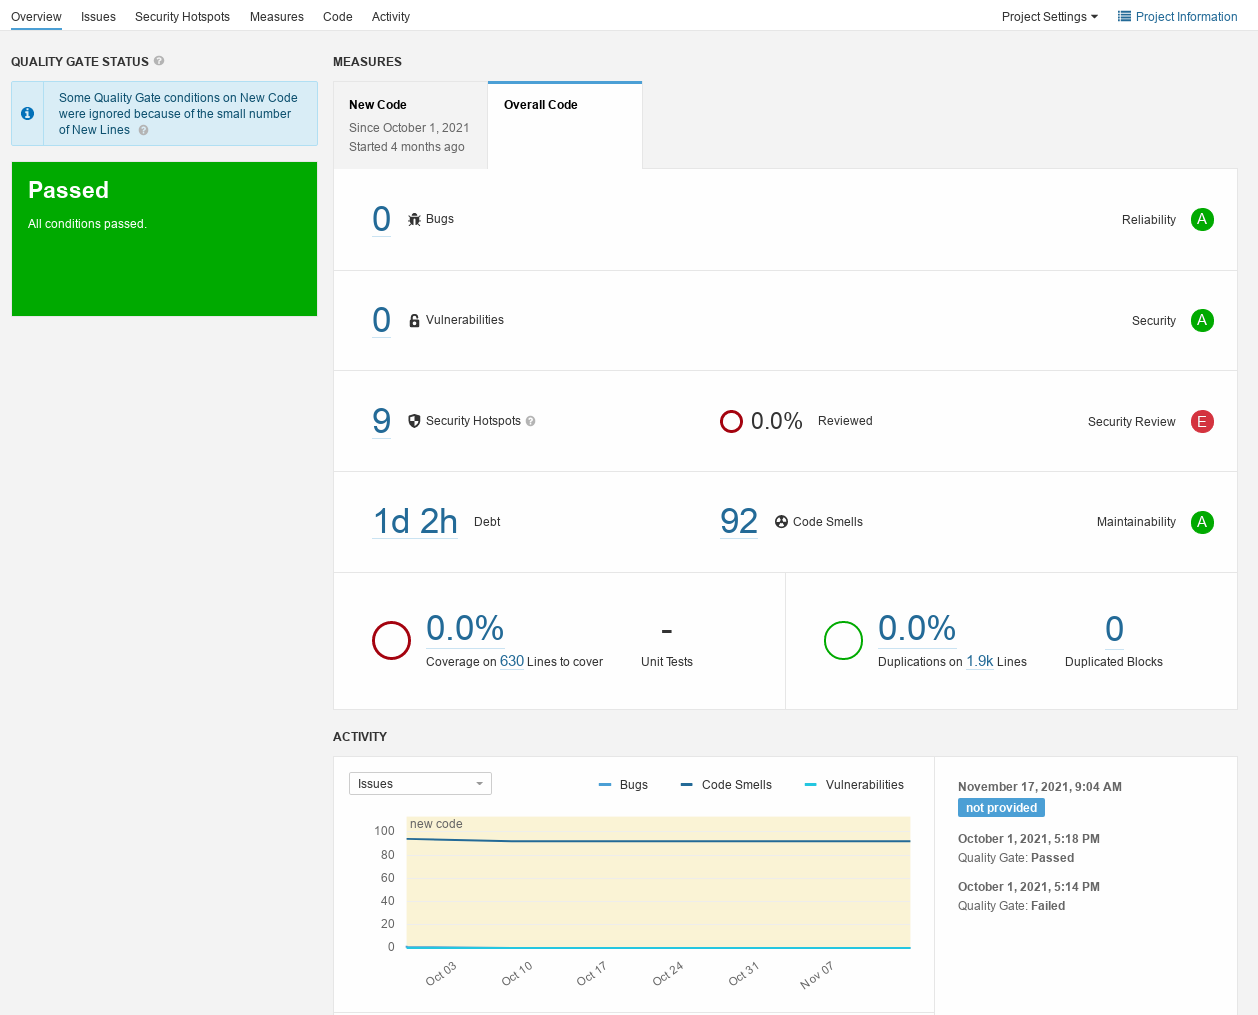
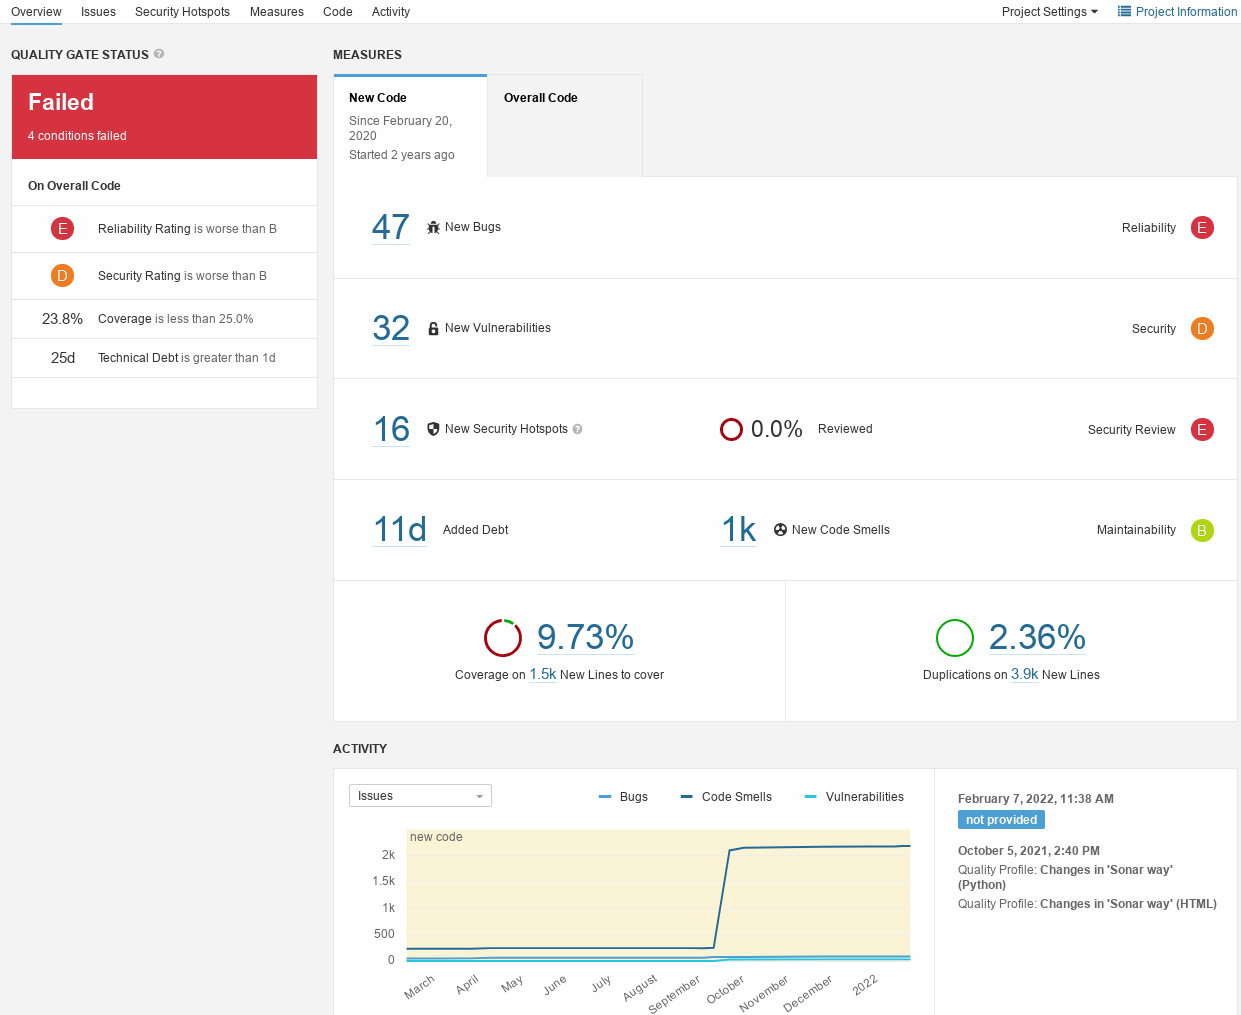
For each of these, SQ reports the number of flaws, a rating (from A to E, with A being the highest / "best" score) for this characteristic, and a link to a trend diagram. Each of the reported information can be clicked and directs the user to more detailed analysis and/or diagrams for this value. The definition of the ratings as provided by SQ is described in the Rating table below (as well as, in more detail, at the official SQ documentation).
| Reliability rating | Security rating | Maintainability rating | ||
|---|---|---|---|---|
A | no bugs | no vulnerabilities | technical debt ratio is less than 5% | |
B | at least one minor bug | at least one minor vulnerability | technical debt ratio is less than 10% | |
C | at least one major bug | at least one major vulnerability | technical debt ratio is less than 20% | |
D | at least one critical bug | at least one critical vulnerability | technical debt ratio is less than 50% | |
E | at least one blocker bug | at least one blocker vulnerability | technical debt ratio is higher than 50% |
SQ reports separately the overall numbers and the values for new code (i.e., for the code developed since previous analysis in SQ). That helps in getting the general insight into the project status, and tracking the trends.
At the bottom of the screen, SQ presents the log of its analysis and a small diagram showing all relevant trends in all analyzed versions of the subject project.
Issues screen
More detailed information is provided by the Issues screen. It presents the list of all issues discovered by SQ, either in the past or currently. On the left-hand side, there are various filters that help in managing the scope of presented issues. Filtering options include the type of issue, its severity, resolution, current status and other information. Please note that the filters are cumulative, i.e., they produce a conjunction of all imposed filters.

SQ capabilities supporting cross-validation
SQ has a number of built-in capabilities that support performing the manual cross-validation of the issues identified and collected by SQ. For each identified issues ('Issues' tab), the reviewer may:
- adjust the type of the issue ('Code Smell', 'Vulnerability', 'Bug' - although it is not recommended to alter this value)
- update the severity/priority of the issue ('Info', 'Minor', 'Major', 'Critical', 'Blocker')
- update the status of the issue ('Confirm', 'Resolve as fixed', 'Resolve as false positive', 'Resolve as won't fix')
- assign the issue to a developer
- add a comment
- add a label/tags
SQ allows for bulk changes to multiple issues (e.g. adding the same tag to multiple issues in one go).
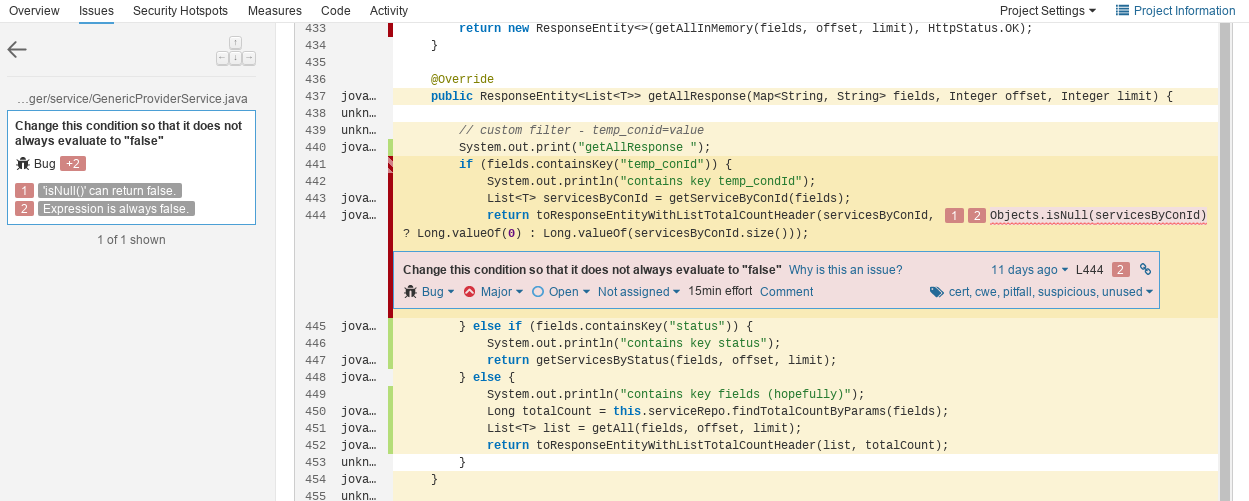
In addition, SQ reports an estimated remediation effort, showing the time required to adequately address and fix the issue.
Outline of the proposed procedure
By clicking on an issue, a reviewer can get a contextual description that includes the affected code snippet, with marked subject areas and recommendation provided by SQ rule that identified the issue. For example, code duplications may span across several locations in the code; SQ identifies and marks each of them, so that it is easier to spot them and evaluate their actual impact on the affected quality characteristic.
For each issue reported by SQ (please note that the current view of the issues can be adjusted using filters), the reviewer:
- analyzes the issue by inspecting the code in SQ; SQ highlights the code affected by the issue
- adjusts the type of the issue (only if it is definitely required!)
- updates the priority of the issue (only if it is definitely required!; the reviewer should be particularly cautious when lowering the priority)
- validates the status of the issue by setting
- 'Confirm', if the issue has been correctly classified by SQ
- 'Resolve as fixed', if the issue has been already fixed in the code since the analysis was performed; SQ will close the issue on the next iteration of analysis
- 'Resolve as false positive', if the context of the issue indicates that it is invalid, although technically it conforms to the definition of the issue of a given type
- 'Resolve as won't fix', if the issue is valid, but does not require fixing (e.g., accepted technical debt)
- optionally adds a comment with further details for this issue
Upon the next analysis, issues marked as 'Resolve as fixed' will be inspected by SQ again. If the issue is indeed no longer present, SQ will mark the issue as Closed; otherwise, the issue will be Reopened.
Please note that issues marked as 'Resolved' can be reopened by the expert at a later stage. Moreover, other attributes (such as tags) of resolved issues cannot be updated; the issue needs to be reopened to be further edited.
The person assigned to the issue should not be altered by the reviewer.
Security Hotspots screen
According to the official SQ documentation a "Security Hotspot highlights a security-sensitive piece of code that the developer needs to review. Upon review, you'll either find there is no threat or you need to apply a fix to secure the code."
The Security Hotspots screen reports all the security hotspots identified by SQ along with detailed explanations. Initially, every hotspot has a status of "To review". For each security hotspot the developer has to review the issue and manually change the status to
- Fixed (after the code has been modified accordingly), or
- Safe (if the code is not at risk and thus doesn't need to be modified)

Measures screen
The Measures screen reports more in-depth data for each quality characteristic and code property (including also size and complexity). This screen provides low-level data and arguments for the issues reported in the Issues screen.

Code screen
The Code screen acts as a formatted preview of the recent code snapshot analyzed by SQ, grouped by the packages. The screen also provides line numbers, the commits that recently changed a given line (including the author, data and commit id). Next, it indicates lines covered by unit tests (in green) and not covered (in red).


The top-right corner provides also a condensed information about the file size, number of issues linked to currently open file and the test coverage metric (showing how completely the unit tests exercise the code in this file).
Activity screen
The Activity screen shows trend diagrams for selected metrics. Trends show how the subject metric(s) changed during subsequent SQ analyses. The data to be presented in the diagram can be customized by selecting the time period and the type of metric.
